Data Integration
Connect multiple sources and aggregate data into a single workspace.

Arcwise provides a structured platform for processing and visualizing large datasets. Our tools help analysts and managers turn raw information into clear reports and interactive dashboards, supporting data-driven decision-making processes.
Explore the Platform
Arcwise offers an automated data analysis platform designed to handle complex datasets with transparency and efficiency. By integrating data ingestion, processing, and visualization into a single workflow, the platform supports analysts in creating detailed reports without manual coding. The system emphasizes clear methodologies, allowing users to understand each step of the analysis pipeline. Whether you are exploring trends or preparing presentations for stakeholders, Arcwise provides a consistent framework for turning data into accessible visual formats. This approach reduces repetitive tasks and helps maintain focus on interpretation and context.

Connect multiple sources and aggregate data into a single workspace.
Generate structured reports with predefined templates and schedules.
Explore data through charts and dashboards that update in real time.
Track every transformation and calculation applied during analysis.
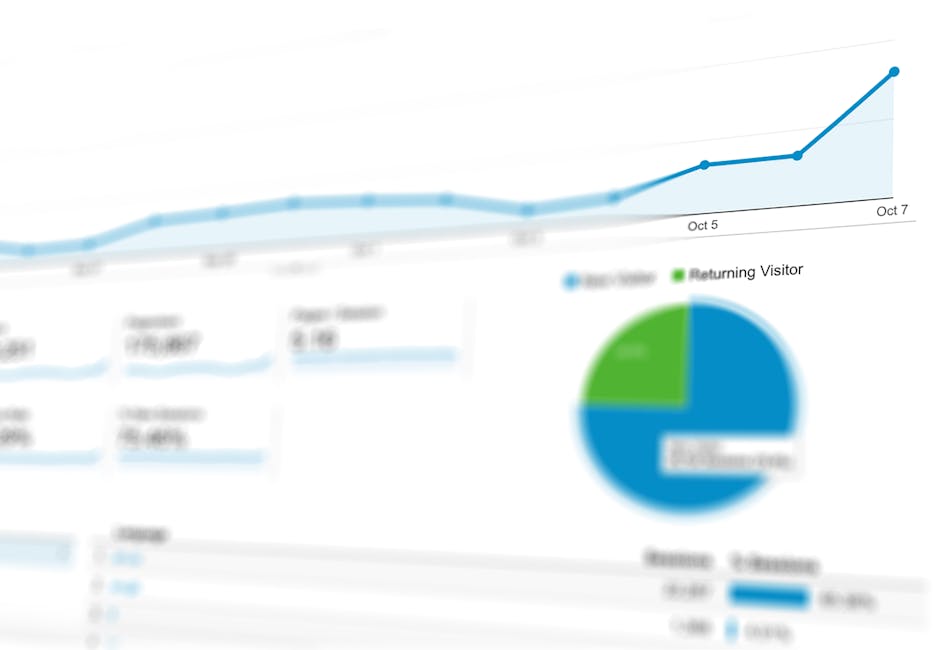
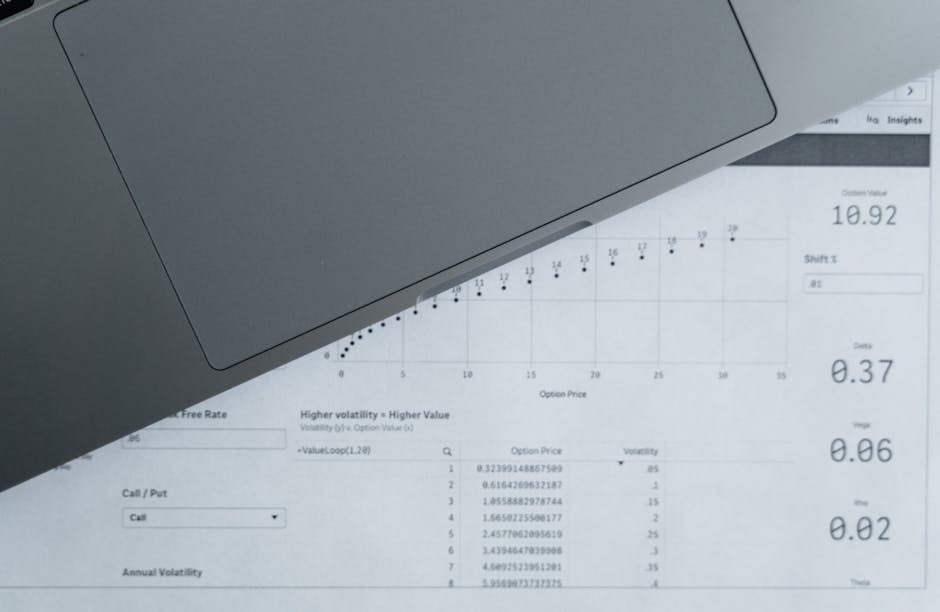
A collection of sample dashboards and report layouts created using Arcwise. These examples illustrate how data can be presented in a clean, structured format to support various analytical contexts.


The Arcwise platform follows a modular pipeline: data is first ingested from connected sources, then cleaned and structured according to user-defined rules. Automated computations and aggregations are applied next, producing intermediate tables. Finally, visualization modules render the results as charts, graphs, or summary reports. Each step can be reviewed and adjusted, ensuring that the final output reflects the intended analytical approach. This process removes manual data manipulation while preserving full oversight of the methodology.
Have questions about implementing automated data analysis? Send us a message and we'll get back to you promptly.
© 2026 Arcwise. All rights reserved.